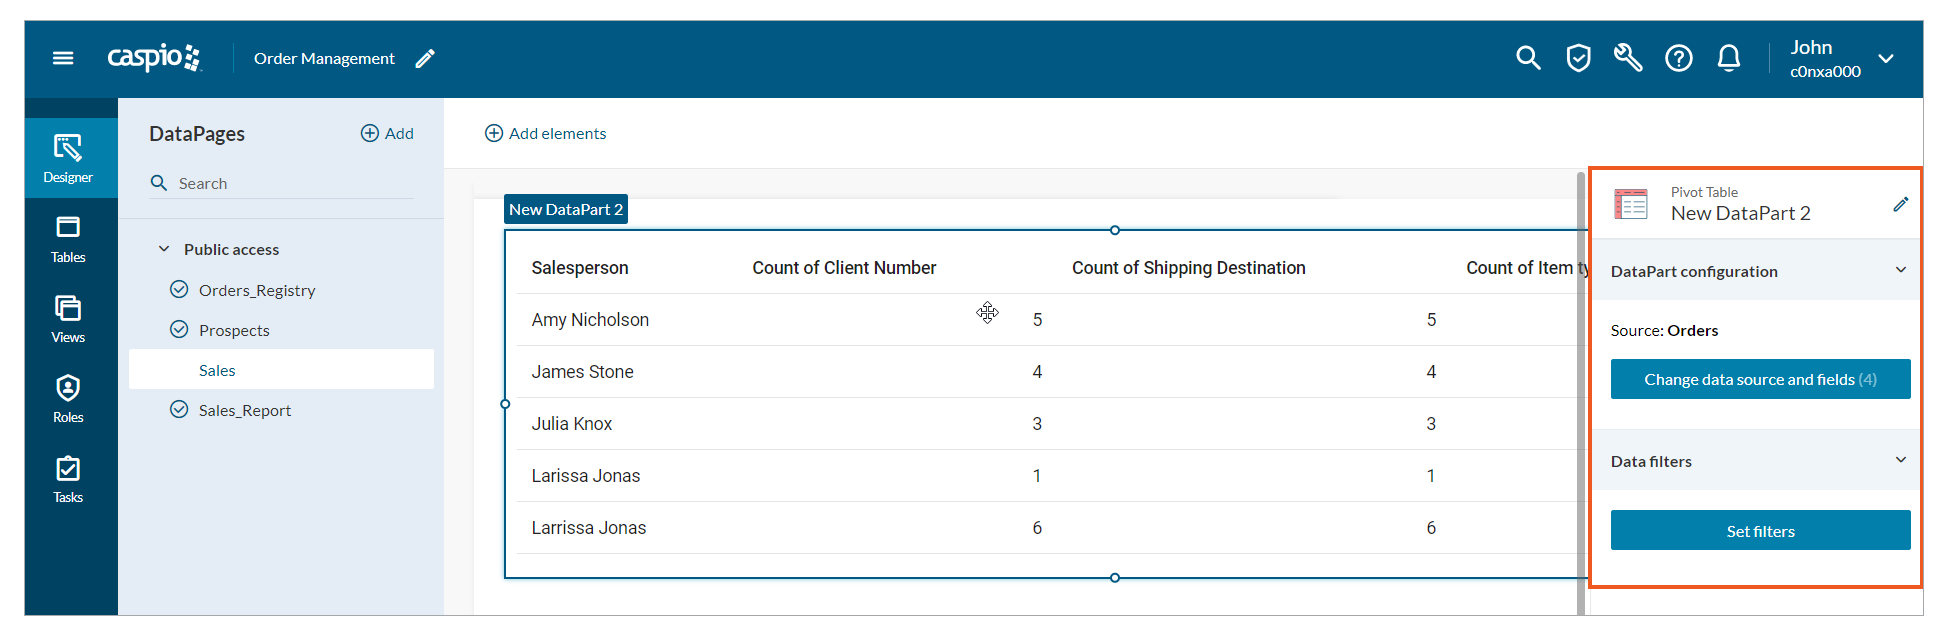
A Pivot Report summarizes data and presents it in table format. It is very useful for records interpretation. For example, you can easily analyze the table that lists products sold by sales representatives to get to know how each representative performs or to identify which product generates the most revenue.
Steps to create Pivot Reports
- Select the fields you want to include in the report:
- In the upper panel, select the Add elements button.
- Select Reports → Pivot.
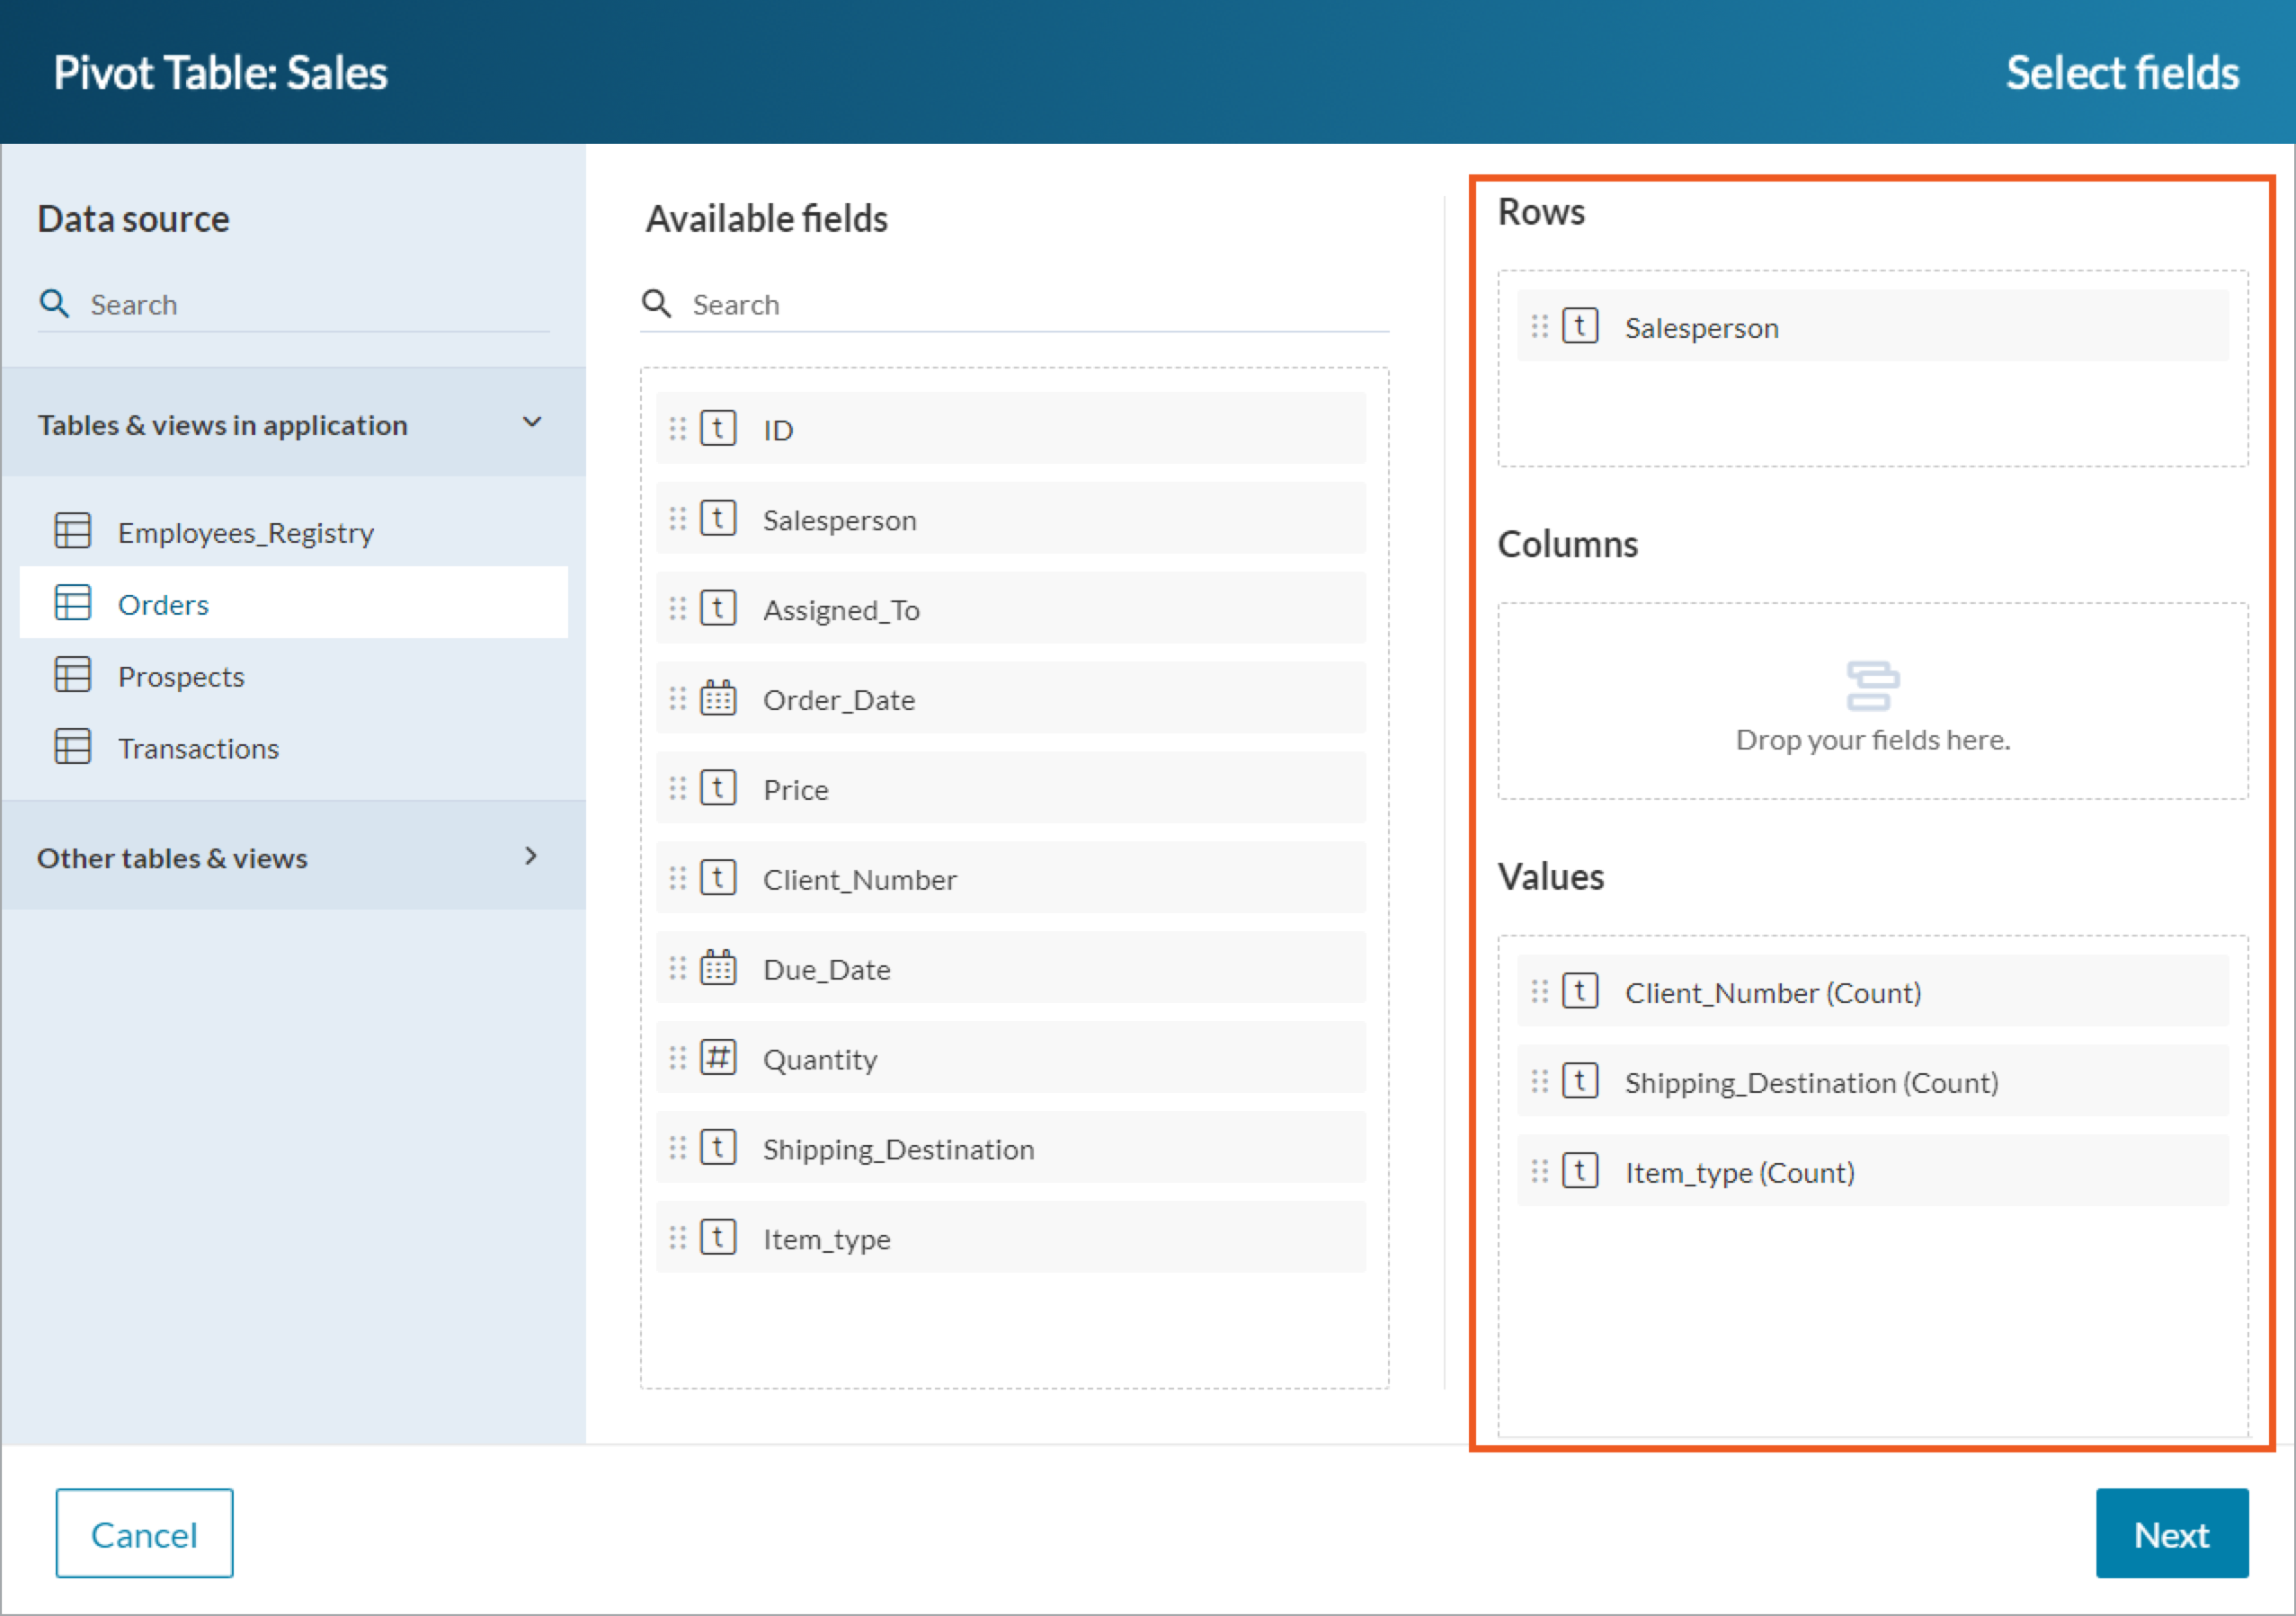
- In the Data source panel, select a table or view that will be the primary data source for your DataPart.
- From the Available fields panel, select the fields you want to use in your app. To do that, click the field or drag and drop it into the Rows, Columns or Values sections.
- To display the records in your pivot table categorized by a column, add the fields to Columns. For example, you can insert the Product field into this section so that a distinct list of all the products from your table will be presented as columns of the pivot table. You can select up to two fields in the Columns section.
- To display the records in your pivot table categorized by a row, add the fields to Rows. For example, you can insert the Salesperson field into this section so that the distinct list of your salespeople will display as rows of a report. You can select up to two fields in the Rows section.
- Values are aggregated results at the cross-section of rows and columns. They enable you to display summary results for a unique column and row. For example, if you want to display revenue by a product of each salesperson, you should insert the Revenue field in the Values section, and select the Sum function. Furthermore, if you want to display the maximum transaction size for each salesperson per product, insert the same Revenue field again, but this time select the Max function.
Note: The following data types are not supported in Pivot Reports: Autonumber, GUID, Prefixed autonumber, Random ID, Text 64000, List-String, List-Date, List-Number.
After adding the fields into the proper sections, you can rearrange their order using drag and drop.
- Select Next.
- Configure the report fields:
- In the left Elements panel, select each field to configure its options.
For the Rows and Columns section:- In the Label section, provide a label for a row or column field.
- If a Date/time field is used for data grouping, in the Data grouping dropdown list, select a type of grouping.
For example, you can group report data by the day of the month to analyze daily sales trends, identify peak selling days, and track revenue performance over time - In the Sorting section, define the order in which field rows should appear in Pivot Table DataPart. Select a desired sort order based on a field data type:
- Sorting from smallest to largest applies to Currency, Number, and Integer fields.
- Sorting from ascending to descending applies to Text(255) and Yes/No fields.
- Sorting from oldest to newest applies to Date/time and Timestamp fields.
For the Values section:
- In the Label section, provide a label for a row or a column.
- In the Summarize values by section, select the summarize function that will be applied in a cross-section of rows and columns. The following functions are available:
- Count – supports all data types, except Yes/No
- Count non-blank – Counts only records that contain values. It applies to Text(255), Number, Integer, Currency, Yes/No, Date/Time, or Timestamp data types.
- Count checkbox selected – Counts the total number of checked checkboxes. It applies to Yes/No data types.
- Count checkbox cleared – Counts the total number of cleared checkboxes. It applies to the Yes/No data type.
- Sum – Returns the sum of a set of numbers. It applies to Number, Integer and Currency data types
- Average – Counts average value from records. It applies to Number, Integer and Currency data types
- Max/Min – Gets the maximum or minimum value from records. It applies to Text(255), Number, Integer, Currency, Date/Time, or Timestamp data types
- StdDev – Returns the biased standard deviation of a set of numbers. It applies to Number, Integer, or Currency data types.
- StdDevp – Calculates the standard deviation for the underlying data in the Values area and constitutes the square root of the variance. Like variance, the standard deviation is a measure of how widely the values vary from their average. It applies to Number, Integer, or Currency data types.
- Var – Calculates the variance of a set of data. The VAR function takes a list of numbers as an argument and calculates the variance of those numbers. It can be used to calculate the variance of a single column of data or the variance of a set of data that is divided into groups. It applies to Number, Integer, or Currency data types.
- Varp – Calculates the variance of a population of numbers. The VARP function is especially useful when you need to calculate the standard deviation of a population of numbers, as it can be used to calculate the variance of a population of numbers that are already in a standard deviation format. It applies to Number, Integer, or Currency data types.
- Select Save.
- In the left Elements panel, select each field to configure its options.
After creating a Pivot Report, you can modify it further by applying additional configurations. Learn more.
Note: You can restrict the visibility of specific records in a report by managing Roles permissions. Learn more.
Configuring additional options for a Pivot Report
After creating a Pivot Report, in the right panel, you can configure additional options of a DataPart. The following configurations are available: