Chart Display OptionsJul 13, 2023 • 2 minutes to read
Chart Display Options
Version 8
In the Display options section, you can configurehow data is presented on your chart.
Stacking
Available for Area, Bar, and Column Charts
Stacking allows you to change how different data categories are stacked on top of each other. The following options are available:
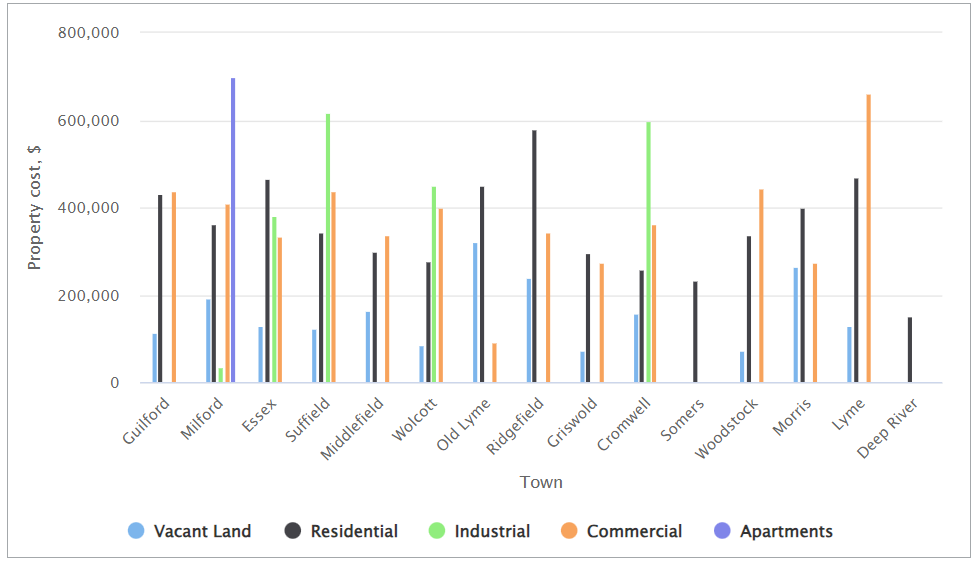
No stacking – each series of bars, columns, or areas is grouped by a separate category.
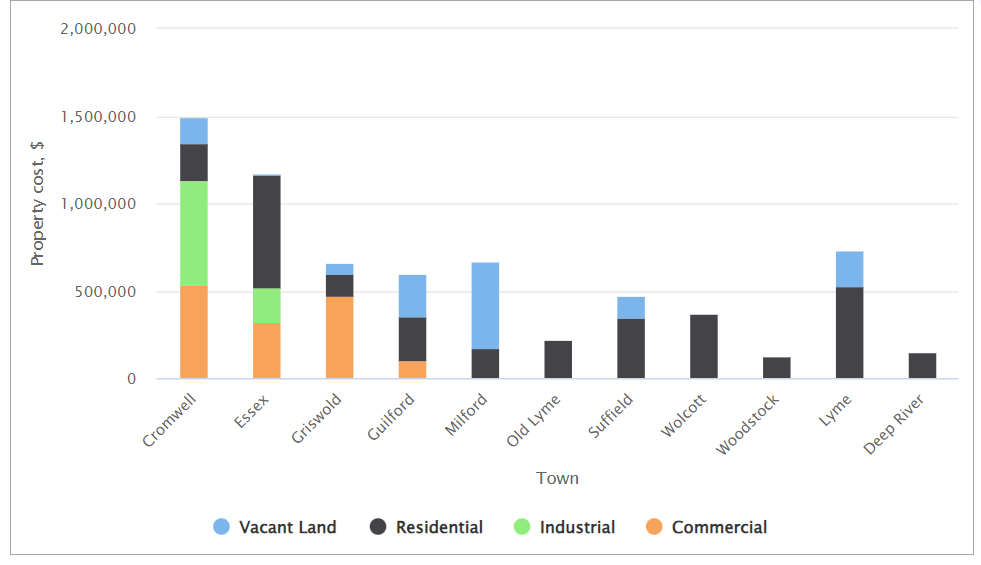
Stacked – series of columns, bars, or areas are stacked on top of each other per each category.
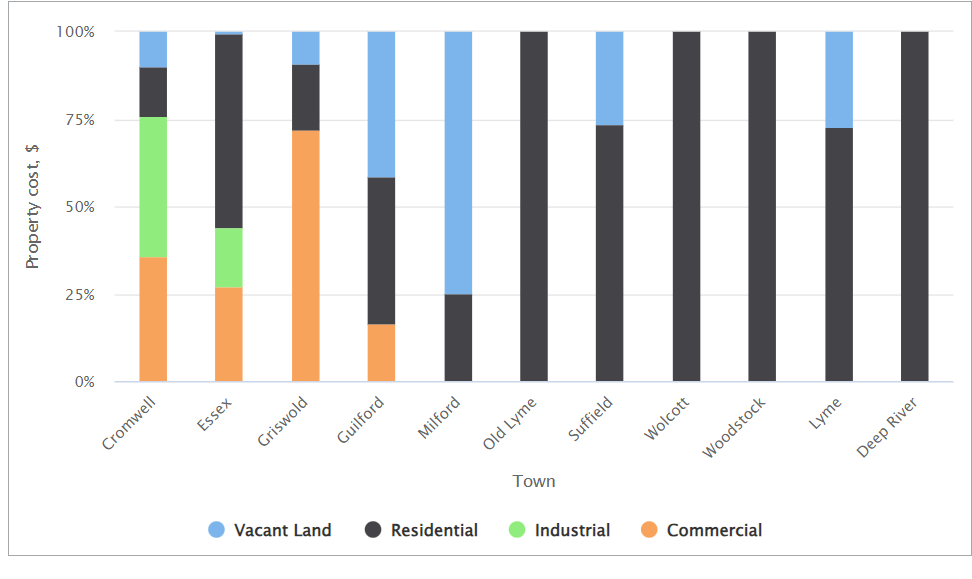
100% stacked – series of columns, bars, or areas are stacked on top of each other to represent, and are displayed in the relative, percentage proportions. In this arrangement, the cumulative total of each stacked column, bar, or area always adds up to 100%.
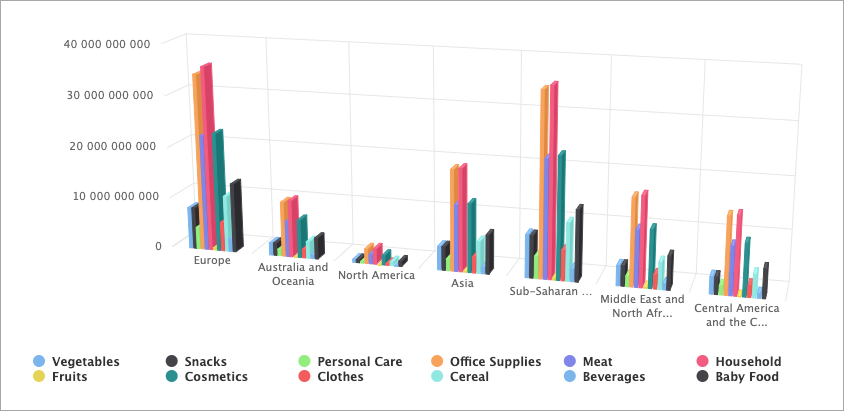
2D/3D data representation
Available for all charts
You can select two-dimensional (2D) or three-dimensional (3D) data representation.
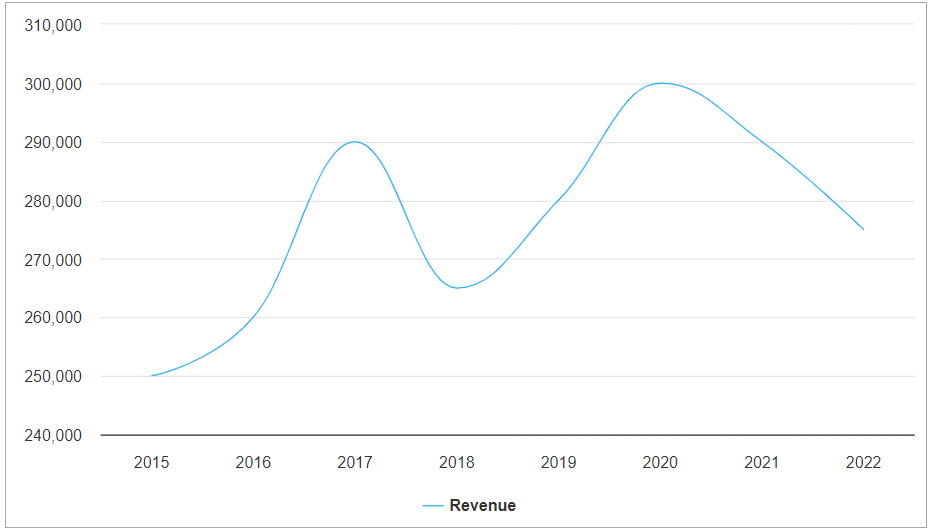
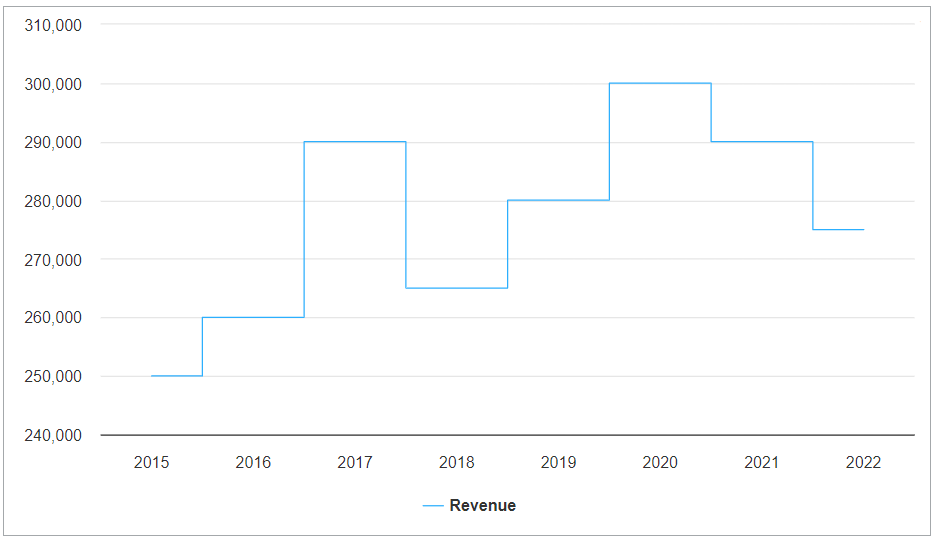
Line, spline, and step data visualization
Available for Area, Line, and Combination Charts
You can represent the data in one of the following chart variants:
Line – displays series of data points connected by straight line segments.
Spline – displays data points connected with smooth curves instead of straight lines.
Step - forms a series of steps between data points.
Note:Spline and step variants currently do not support a 3D appearance. If you choose a 3D chart representation and select either spline or step variant, the chart will automatically switch to a 2D representation.